Read your dashboard
Measure your portfolio, your prospecting activity and your sales over the period of your choice.
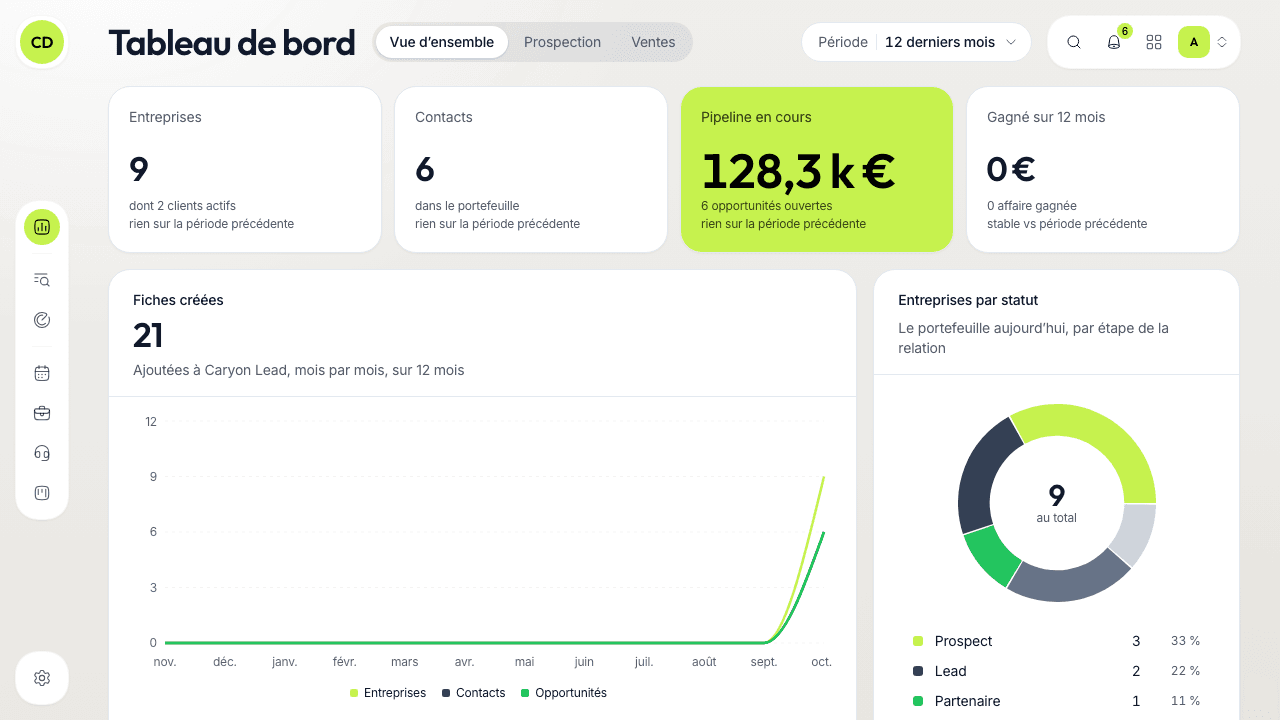
The Tableau de bord (Dashboard — in the left-hand menu, key G then D) measures what happened over a period and compares it with the previous one. It answers "where do I stand?", where the Agenda answers "what do I have to do today?".
Choose what you measure
The settings sit on the title line and apply to every block of the page:
- « Période » (Period): the last seven, thirty or ninety days, or the last twelve months (the default). For another range, pick two dates in the calendar then « Appliquer » (Apply); « Effacer » (Clear) goes back to the default.
- « Moi » / « Équipe » (Me / Team), if people report to you: « Moi » counts your companies, opportunities and actions; « Équipe » those of the people you manage. The workspace owner and administrators see the whole workspace.
- « Pipeline », from two pipelines on: a single one or « Tous les pipelines » (All pipelines).
Reading the comparisons
Each figure is compared with the period right before it, of the same length: "+12 % vs période précédente" (vs previous period). Green means it moves the right way; red, the wrong way (for a delay, going down is good). When the previous period is empty, the tile says so instead of showing an endless increase.
The three tabs switch without reloading the page.
The « Vue d'ensemble » (Overview) tab
Your portfolio and what happened in it:
- four tiles: « Entreprises » (Companies) followed, « Contacts », « Pipeline en cours » (Pipeline in progress — amount and number of open opportunities) and what was won over the period;
- « Fiches créées » (Records created): companies, contacts and opportunities added;
- « Entreprises par statut » (Companies by status), « Opportunités par issue » (Opportunities by outcome: in progress, won, lost);
- « Volume d'activité » (Activity volume): actions done, calls and meetings, emails, others;
- « Actions à faire » (Actions to do), for today or this week, those "planned before today" in red;
- « Meilleurs comptes » (Top accounts) by amount won, and « Activité récente » (Recent activity).
When there is nothing to measure yet, the page suggests the first steps: « Trouver des entreprises » (Find companies), « Importer un fichier » (Import a file), « Ouvrir le Radar » (Open the Radar), « Voir le portefeuille » (See the portfolio).
The « Prospection » tab
Two parts, each loading at its own pace.
Activity. Two tiles, « Appels passés » (Calls made) and « Actions faites » (Actions done), then a table per person: « Votre activité » (Your activity — « Activité par personne », Activity per person, in the Team view). For each person: the actions « Prévues avant » (planned before) today, the « Planifiées » (planned), the calls made, the actions done, the breakdown of call « Issues » (outcomes) and the « Dernière action » (last action). Clicking a name opens their actions, which you can close or postpone if your role allows it.
Opportunities. Where they come from and what they become: new opportunities, « Taux de conversion » (Conversion rate), « Délai de conversion » (Conversion delay), « Valeur moyenne » (Average value), then « Opportunités créées », « Sources », « Entonnoir des étapes » (Stage funnel), « Conversion par source », « Valeur et vitesse par source » (Value and speed per source), « Temps passé par étape » (Time spent per stage), « Où se perdent les affaires » (Where deals are lost) and « Dernières victoires » (Latest wins).
Where does an opportunity come from?
The source is the origin chosen on the opportunity's record (Prospection, Entrant — inbound, Recommandation, Événement, Partenaire, Autre). Failing that, it is the way the company entered your portfolio (Search, Radar, manual add, LinkedIn extension, import).
The « Ventes » (Sales) tab
Your pipeline and what it has signed: four tiles (« Pipeline en cours », « Prévision pondérée » — weighted forecast, what was won over the period, « Taux de gain » — win rate), the pipeline by stage, by owner and by sector, the « Chiffre signé » (Signed revenue), the « Prévision par mois de clôture » (Forecast by closing month) over six months and the largest open opportunities.
The weighted forecast applies to each opportunity the win chance of its stage, worked out from your already closed deals. As long as you have no closed opportunity, the tile shows « — ».
With several pipelines, some blocks (the funnel, the time spent per stage) only make sense within one: the dashboard invites you to pick one.
Go further
A question not answered here? Write to us at contact@caryon.app.
Import your companies and contacts
Import an Excel or CSV file, map its columns, check the report, or copy contacts from another of your workspaces.
Prospect from LinkedIn with the extension
Add a contact to Caryon Lead from their LinkedIn profile, spot the people you already follow, and find your LinkedIn messages in the history.